When you create a view in TM1Connect, you typically start off by selecting an existing view (either in TM1 or in TM1Connect) and you manipulate the dimensions into the appropriate rows and columns to satisfy your data needs, but that doesn't mean that your views can only return the information you see during design time. TM1Connect views are dynamic in nature and the content of these views can be altered at run time.
When you create a view in TM1Connect, you are basically designing the structure for how the data is to be returned, but you can still control the content from the SQL query you specify. In fact, the WHERE clause can be used to filter the results to return only the information you need for your Tableau dashboards at the level of granularity and only at the time when the users needs it, so that the user doesn't have to wait for detail data to be loaded and processed by Tableau. This also enables you to leverage the business logic in TM1 so that you do not have to re-create that logic in your dashboard. For more information on how to use dynamic queries, read the case study Title Dimensions and the SQL WHERE Clause.
# Dynamic Real-Time Dashboards - Oh Yeah!
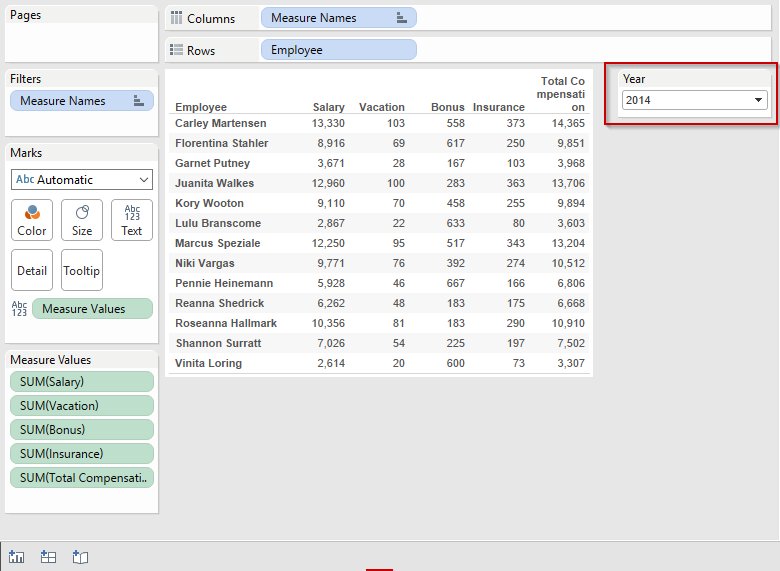
The following image shows a data table created in a Tableau dashboard page. It contains a list of all of the employees within a specific department and the components of the employee's total compensation, such as Salary, vacation, bonus, etc. This list is also accompanied by a year dropdown, which will filter the list by the employees within that time period.
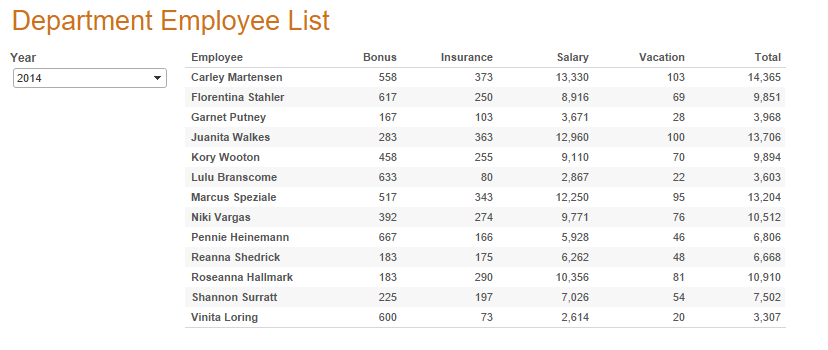
With this dashboard, when the user selects a different year, Tableau will automatically re-issue the query to TM1Connect and TM1Connect will retrieve the appropriate data from TM1 live and in real-time! So now your executives have immediate access to the planning information in TM1 as it is being worked on (which can sometimes be a double-edged sword ).
# Peeking under the covers
So how did we do that? And, what is needed to make this happen in Tableau? Well, it turns out that it is really simple, actually, just follow these steps:
- Create a view in TM1Connect that represents the data to display in your dashboard
- Connect Tableau to TM1Connect and drag the view a datasource page
- Convert the data source in Tableau to a custom SQL query and insert the parameter(s) that you want the user to be able to control.
- Create a worksheet page with the desired rows & columns layout along with the relevant parameters from the previous step, and voila! Dynamic Dashboards!
That seems simple enough, right? Yeah,...right! Ok, Ok, Ok. Building dashboards is not exactly as simple as slapping a table on a page, but when it comes to making the pages dynamic, it really boils down to "parameterizing" your queries to TM1Connect. If you can do this, you will leverage TM1's capability to apply the business logic built into the model as well as TM1's consolidation power to aggregate the data, all the while keeping the data movement between TM1 and Tableau to a minimum (making your performance hungry users happy in the process)! Let's examine these steps a little bit deeper one by one:
# 1. Create a view in TM1Connect
The first step in creating a dashboard in Tableau using TM1Connect is to decide first what you want to display in the dashboard, and then determine what data content is necessary to populate the page. In our example, it is a listing of employees and their yearly compensation information. When you look at this, and compare it to the source cube in TM1, you may find that there are other dimensions in the cube, but according to the dashboard, the user doesn't really need to see those other dimensions in the tabular list of data. They DO, however, need to be able to select how the displayed data is filtered (in our case, the years). The screenshot from TM1Connect below shows how the view is laid out:
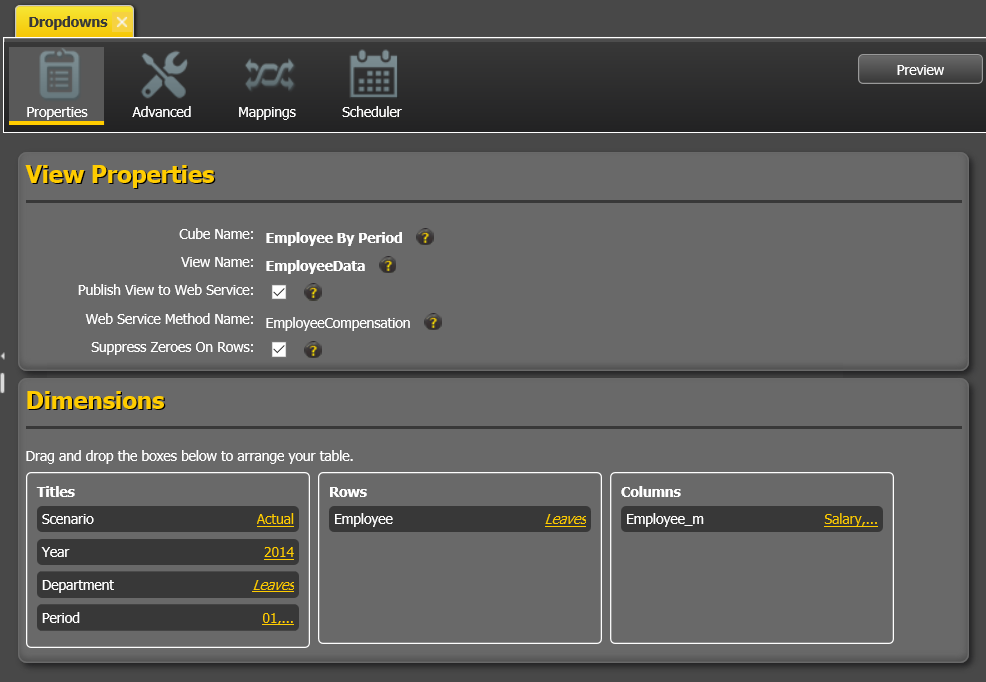
Because of the way a relational system works, you are required to have all columns referenced in the SELECT or WHERE available somewhere in the table, but with TM1 cubes, the data filters are in the title dimensions and these are not part of the rows and columns. TM1Connect lets you set these values in the WHERE clause of the SQL statement just like you would any column. So with the above view, we can use Department, Scenario, Year and Employee Measures (Employee_m) dimensions at any level of consolidation right in the WHERE clause!
Once you have the view defined, make sure the Publish View to Web Service is checked then save the view. This will be the name of the table you will see in Tableau when you connect to TM1Connect (in our case, we called the view Dropdowns).
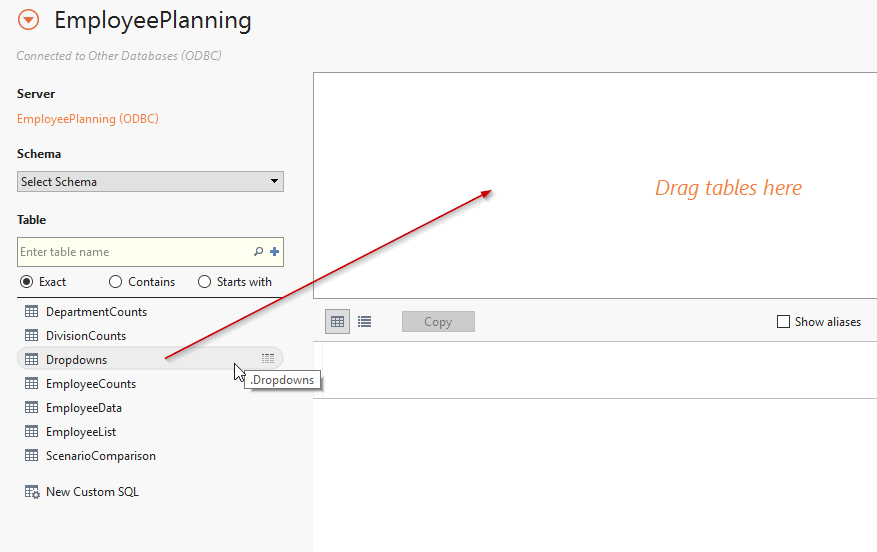
# 2. Bring the view into a Tableau as a datasource
With the view saved and published, connect to TM1 connect using the Other Databases (ODBC) server connection and select the appropriate DSN or use the driver directly and specify the connection parameters. (See TM1Connect Help for further assistance with setting up a DSN.) Once you are connected, all of the views that have been published appear as a standard relational style table and can be dragged into the datasource table pane
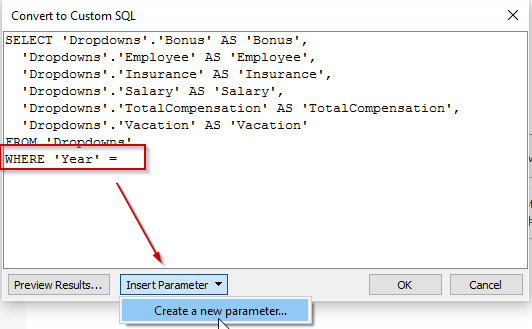
# 3. Convert the query to Custom SQL
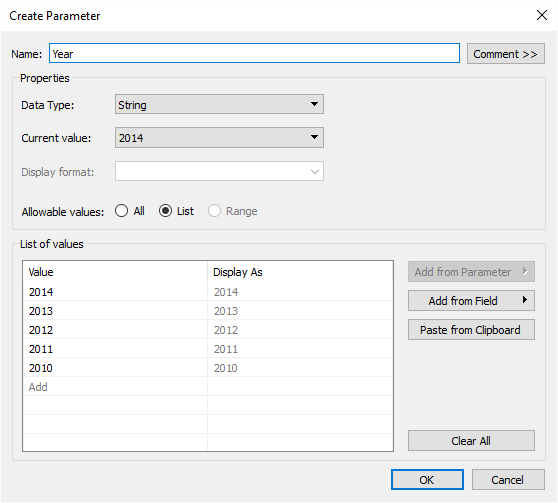
With the table in the datasource tab, select Convert To Custom SQL from the Data menu in Tableau. When you do this, Tableau will display a dialog with the pre-generated SQL query. We will augment the query with a WHERE clause using the Year dimension and insert a parameter that the user will be able to control. At the bottom of the dialog is a dropdown button labeled Insert Parameter and fill in the appropriate values for the dropdown.
# 4. Create a worksheet using the datasource
You are ready to create a dynamic worksheet from Tableau to TM1Connect. Using the datasource above, drag in the rows and columns you want in your table. After you have laid out the table according to your needs, choose Parameters -> Year from the Analysis menu and you will see the Year dropdown show up in the worksheet.
You now have a dynamic view pulling an employee list by a user-selected year from TM1 in real-time! As the user changes the year, it will automatically re-issue the query to TM1Connect and it will prepare and reformat the data for Tableau. No data extracts and loads to worry about. No TI scripts to write. And, best of all, you can use WHERE clauses that leverage any level of consolidation and you didn't have to write any business logic in Tableau at all! Can't get any easier than that!